

BioFluidSim
Ever observed bioluminescence? This project was built to explore a GPU-driven fluid simulation approach to simulating reactive bioluminescent emission (following decay rates of Lingulodinium polyedrum). Built in Unreal Engine, the system holds a 1.36ms game thread cost against ~2.77ms for a leading commercial solution at matched scale.
An artist drops a Detection Component onto any object that should disturb the surface, then tunes color, force, viscosity, and decay from exposed parameters. Retargeting water to snow, mud, or fire requires no shader work.
What I Built:
Dual-resolution Eulerian Fluid Solver Architecture
Biologically Parameterized Emission Model
Comparative GPU pipeline evaluation
Thesis awarded High Honors in Computer Science, Dartmouth College.
— Github Repo Available Upon Request —
Ever observed bioluminescence? This project was built to explore a GPU-driven fluid simulation approach to simulating reactive bioluminescent emission (following decay rates of Lingulodinium polyedrum). Built in Unreal Engine, the system holds a 1.36ms game thread cost against ~2.77ms for a leading commercial solution at matched scale.
An artist drops a Detection Component onto any object that should disturb the surface, then tunes color, force, viscosity, and decay from exposed parameters. Retargeting water to snow, mud, or fire requires no shader work.
What I Built:
Dual-resolution Eulerian Fluid Solver Architecture
Biologically Parameterized Emission Model
Comparative GPU pipeline evaluation
Thesis awarded High Honors in Computer Science, Dartmouth College.
— Github Repo Available Upon Request —
Ever observed bioluminescence? This project was built to explore a GPU-driven fluid simulation approach to simulating reactive bioluminescent emission (following decay rates of Lingulodinium polyedrum). Built in Unreal Engine, the system holds a 1.36ms game thread cost against ~2.77ms for a leading commercial solution at matched scale.
An artist drops a Detection Component onto any object that should disturb the surface, then tunes color, force, viscosity, and decay from exposed parameters. Retargeting water to snow, mud, or fire requires no shader work.
What I Built:
Dual-resolution Eulerian Fluid Solver Architecture
Biologically Parameterized Emission Model
Comparative GPU pipeline evaluation
Thesis awarded High Honors in Computer Science, Dartmouth College.
— Github Repo Available Upon Request —
Type
UE5, Simulation, Fluid Solver
Type
UE5, Simulation, Fluid Solver
Development
6 months
Development
6 months
Real-Time Simulation of Bio-luminescent Light Propagation using Compute Shaders within Unreal Engine 5
Real-Time Simulation of Bio-luminescent Light Propagation using Compute Shaders within Unreal Engine 5
Figure 1: Snapshot of BioFluidSim
Figure 1: Snapshot of BioFluidSim
Why BioFluidSim?
Why BioFluidSim?
Current real-time fluid solutions either prioritize physically based simulation without biologically accurate bioluminescent emission, or they produce visually convincing bioluminescence without simulating the underlying fluid dynamics.
Current real-time fluid solutions either prioritize physically based simulation without biologically accurate bioluminescent emission, or they produce visually convincing bioluminescence without simulating the underlying fluid dynamics.
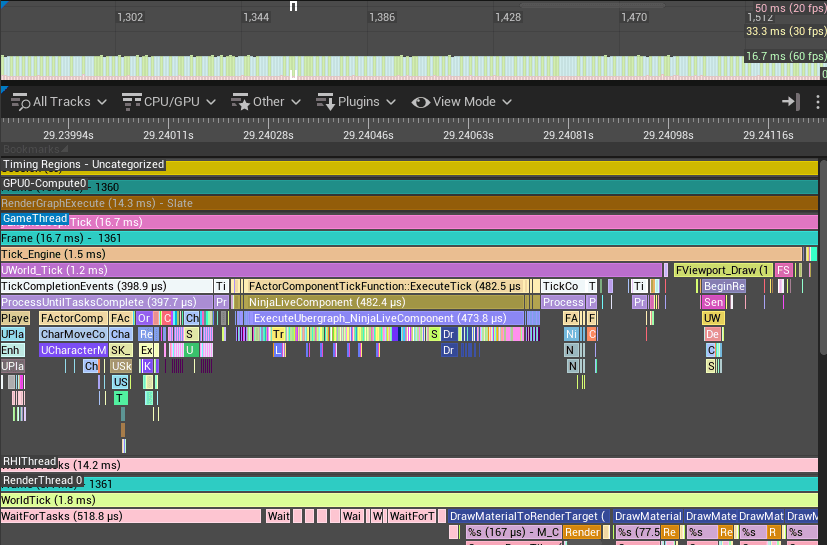
Figure 2: Unreal Insights trace of FluidNinjaLive
Figure 2: Unreal Insights trace of FluidNinjaLive
FluidNinja Live was, at the time, the leading commercial solution that could address this. Profiling it revealed a per-frame simulation driven from Blueprint, placing dispatch and orchestration cost on the game thread at 2.77 ms and exceeding its 1.8 ms GPU cost, making the game thread the limiting factor at this scale. BioFluidSim was designed to address both limitations by implementing a GPU-native fluid simulation that directly couples biologically parameterized light emission with the simulated velocity field, enabling physically driven bioluminescent behavior in real time.
FluidNinja Live was, at the time, the leading commercial solution that could address this. Profiling it revealed a per-frame simulation driven from Blueprint, placing dispatch and orchestration cost on the game thread at 2.77 ms and exceeding its 1.8 ms GPU cost, making the game thread the limiting factor at this scale. BioFluidSim was designed to address both limitations by implementing a GPU-native fluid simulation that directly couples biologically parameterized light emission with the simulated velocity field, enabling physically driven bioluminescent behavior in real time.
Performance
Performance
For a fair comparison, BioFluidSim was downscaled to match the dimensions of the commercial solution's (FluidNinja) demo scene. BioFluidSim also uses the same material instances provided with FluidNinja to isolate the cost of the simulation itself. All performance metrics were captured using stat unit under these matched conditions with 30 Jacobi iterations, a 128 × 128 simulation grid, and a 512 × 512 dye grid.
For a fair comparison, BioFluidSim was downscaled to match the dimensions of the commercial solution's (FluidNinja) demo scene. BioFluidSim also uses the same material instances provided with FluidNinja to isolate the cost of the simulation itself. All performance metrics were captured using stat unit under these matched conditions with 30 Jacobi iterations, a 128 × 128 simulation grid, and a 512 × 512 dye grid.
Figure 3: BioFluidSim (full 16-stage compute Navier-Stokes solver)
Figure 3: BioFluidSim (full 16-stage compute Navier-Stokes solver)
Figure 4: FluidNinja Live (commercial fragment-shader fluid solution)
Figure 4: FluidNinja Live (commercial fragment-shader fluid solution)
Metric | FluidNinja (v1.8) | BioFluidSim (mine) |
|---|---|---|
| Game thread | 2.77ms | 1.36ms |
| Draw thread | 3.15ms | 2.35ms |
| RHIT thread | 1.9ms | 1.55ms |
| GPU | 1.7ms | 3.7ms |
| Draw calls | 90 | 168 |
Metric | FluidNinja (v1.8) | BioFluidSim (mine) |
|---|---|---|
| Game thread | 2.77ms | 1.36ms |
| Draw thread | 3.15ms | 2.35ms |
| RHIT thread | 1.9ms | 1.55ms |
| GPU | 1.7ms | 3.7ms |
| Draw calls | 90 | 168 |
Figure 5: Performance metrics measured via stat unit
Figure 5: Performance metrics measured via stat unit
BioFluidSim holds lower cost on all three CPU-side threads, with the game thread difference the largest at roughly half FluidNinja's cost. The GPU and draw call figures go the other way. BioFluidSim runs a full 16-stage solve on the GPU where FluidNinja approximates the fluid in fragment shaders, so the higher GPU cost is the price of the lower CPU cost rather than a separate shortcoming.
BioFluidSim holds lower cost on all three CPU-side threads, with the game thread difference the largest at roughly half FluidNinja's cost. The GPU and draw call figures go the other way. BioFluidSim runs a full 16-stage solve on the GPU where FluidNinja approximates the fluid in fragment shaders, so the higher GPU cost is the price of the lower CPU cost rather than a separate shortcoming.
Additional Use Cases
Additional Use Cases
Since the shear color ramp and viscosity coefficients are both runtime parameters, the same system supports non-biological color mappings and higher-viscosity fluids without any underlying HLSL changes.
Since the shear color ramp and viscosity coefficients are both runtime parameters, the same system supports non-biological color mappings and higher-viscosity fluids without any underlying HLSL changes.
Figure 6: Parameter Overrides simulating different fluid behaviors (snow)
Figure 6: Parameter Overrides simulating different fluid behaviors (snow)
Figure 7: Parameter Overrides simulating different color mappings (fire, northern lights)
Figure 7: Parameter Overrides simulating different color mappings (fire, northern lights)
System Architecture
System Architecture
The simulation is composed of four cooperative subsystems: The Detection Component, Tracking Manager, BioFluidSim Manager, and Landscape Manager.
The simulation is composed of four cooperative subsystems: The Detection Component, Tracking Manager, BioFluidSim Manager, and Landscape Manager.

Figure 8: BioFluidSim Infrastructure Diagram
Figure 8: BioFluidSim Infrastructure Diagram
Detection Component (DC): An actor component that can be attached to any physical object capable of disturbing the fluid surface. It measures surface tension (ST) data and sends it to the Tracking Manager for encoding.
Tracking Manager: Serves as the encoding and rate-limiting layer between the Detection Components and the fluid solver. It stores each object's location, velocity, and depth in an RGBA texture map.
BioFluidSimulation Manager: Manages the overall fluid simulation and light propagation system. It owns the Niagara Grid2D instance responsible for executing the GPU compute pipeline.
The Landscape Manager: Handles the projection and visualization of the simulation onto the environment, ensuring the computed fluid and bioluminescent effects are correctly represented within the scene.
Detection Component (DC): An actor component that can be attached to any physical object capable of disturbing the fluid surface. It measures surface tension (ST) data and sends it to the Tracking Manager for encoding.
Tracking Manager: Serves as the encoding and rate-limiting layer between the Detection Components and the fluid solver. It stores each object's location, velocity, and depth in an RGBA texture map.
BioFluidSimulation Manager: Manages the overall fluid simulation and light propagation system. It owns the Niagara Grid2D instance responsible for executing the GPU compute pipeline.
The Landscape Manager: Handles the projection and visualization of the simulation onto the environment, ensuring the computed fluid and bioluminescent effects are correctly represented within the scene.
The 16-Stage Solver
The 16-Stage Solver
The BioFluidSim solver is implemented as a 16-stage Niagara Grid2D compute pipeline operating over two grids of differing resolution: a 128 × 128 simulation grid (SimGrid) carrying velocity, pressure, divergence, and curl attributes, and a 512 × 512 dye grid (DyeGrid) carrying the biological emission density.
The BioFluidSim solver is implemented as a 16-stage Niagara Grid2D compute pipeline operating over two grids of differing resolution: a 128 × 128 simulation grid (SimGrid) carrying velocity, pressure, divergence, and curl attributes, and a 512 × 512 dye grid (DyeGrid) carrying the biological emission density.

Figure 9: BioFluidSim Niagara Solver Simulation Stages
Figure 9: BioFluidSim Niagara Solver Simulation Stages
External forces are applied first, then vorticity confinement, self-advection, divergence measurement, pressure solve, and projection. Computing divergence after advection rather than before captures the incompressibility error introduced by the semi-Lagrangian scheme itself, producing a more accurate pressure correction.
Injection: Foot contact is encoded into a render target painted each frame from Blueprint. RG carry velocity direction and B carries contact depth. The solver decodes velocity and blends it against the existing field rather than overwriting it, preserving at least half the existing momentum each frame.
External forces are applied first, then vorticity confinement, self-advection, divergence measurement, pressure solve, and projection. Computing divergence after advection rather than before captures the incompressibility error introduced by the semi-Lagrangian scheme itself, producing a more accurate pressure correction.
Injection: Foot contact is encoded into a render target painted each frame from Blueprint. RG carry velocity direction and B carries contact depth. The solver decodes velocity and blends it against the existing field rather than overwriting it, preserving at least half the existing momentum each frame.
External forces are applied first, then vorticity confinement, self-advection, divergence measurement, pressure solve, and projection. Computing divergence after advection rather than before captures the incompressibility error introduced by the semi-Lagrangian scheme itself, producing a more accurate pressure correction.
Injection: Foot contact is encoded into a render target painted each frame from Blueprint. RG carry velocity direction and B carries contact depth. The solver decodes velocity and blends it against the existing field rather than overwriting it, preserving at least half the existing momentum each frame.
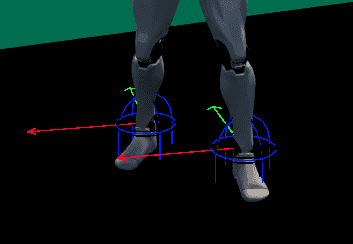

Figure 10: Inject Player RDTG uses render target from tracking manager to drive fluid solver
Figure 10: Inject Player RDTG uses render target from tracking manager to drive fluid solver
Vorticity: Curl is computed by central difference over the four cardinal neighbors, then vorticity confinement re-injects rotational energy at existing vortex cores as a force tangent to the rotation.
Advection: The velocity field self-advects by backward particle trace, sampled bilinearly. Dissipation is applied with a soft-knee clamp that passes velocities below threshold unchanged and retains only 10% of the excess above it, bounding growth while preserving direction.
Pressure: The previous frame's pressure is carried forward as an initial estimate. Jacobi iterations then solve the Poisson equation, alternating red-black to improve spatial convergence at lower per-frame cost. Subtracting the pressure gradient projects the field back to divergence-free (Helmholtz-Hodge).
Emission: Dye is injected where contact density exceeds the mechanosensory activation threshold, with color blended toward the 474–480 nm peak as disturbance increases. A collision mask darkens the contact center, reproducing the dark-center, bright-ring pattern seen in bioluminescent surf.
Vorticity: Curl is computed by central difference over the four cardinal neighbors, then vorticity confinement re-injects rotational energy at existing vortex cores as a force tangent to the rotation.
Advection: The velocity field self-advects by backward particle trace, sampled bilinearly. Dissipation is applied with a soft-knee clamp that passes velocities below threshold unchanged and retains only 10% of the excess above it, bounding growth while preserving direction.
Pressure: The previous frame's pressure is carried forward as an initial estimate. Jacobi iterations then solve the Poisson equation, alternating red-black to improve spatial convergence at lower per-frame cost. Subtracting the pressure gradient projects the field back to divergence-free (Helmholtz-Hodge).
Emission: Dye is injected where contact density exceeds the mechanosensory activation threshold, with color blended toward the 474–480 nm peak as disturbance increases. A collision mask darkens the contact center, reproducing the dark-center, bright-ring pattern seen in bioluminescent surf.
Biological Emission Model
Biological Emission Model
Dinoflagellate emission peaks around 474–480 nm, perceived as deep blue-cyan, consistent with the luciferase reaction chemistry of the species. Disturbance forces on the cells scale with fluid velocity via Stokes drag, so the solver accumulates foot contact into a density field that fades between contacts.
Flash intensity is the activation strength normalized between the mechanosensory threshold and saturation, and the decay constant k is interpolated across that range. For water, k runs 1.0 to 10.0 s⁻¹, giving flashes of 0.1 to 1.0 s.
Dinoflagellate emission peaks around 474–480 nm, perceived as deep blue-cyan, consistent with the luciferase reaction chemistry of the species. Disturbance forces on the cells scale with fluid velocity via Stokes drag, so the solver accumulates foot contact into a density field that fades between contacts.
Flash intensity is the activation strength normalized between the mechanosensory threshold and saturation, and the decay constant k is interpolated across that range. For water, k runs 1.0 to 10.0 s⁻¹, giving flashes of 0.1 to 1.0 s.

Figure 11: BioFluidSim Biological Emission Map
Figure 11: BioFluidSim Biological Emission Map
Exposed Parameters (Color)
Exposed Parameters (Color)
The final composition stage exposes the emission look as runtime parameters, so a variant is authored by changing values rather than editing HLSL.
The final composition stage exposes the emission look as runtime parameters, so a variant is authored by changing values rather than editing HLSL.

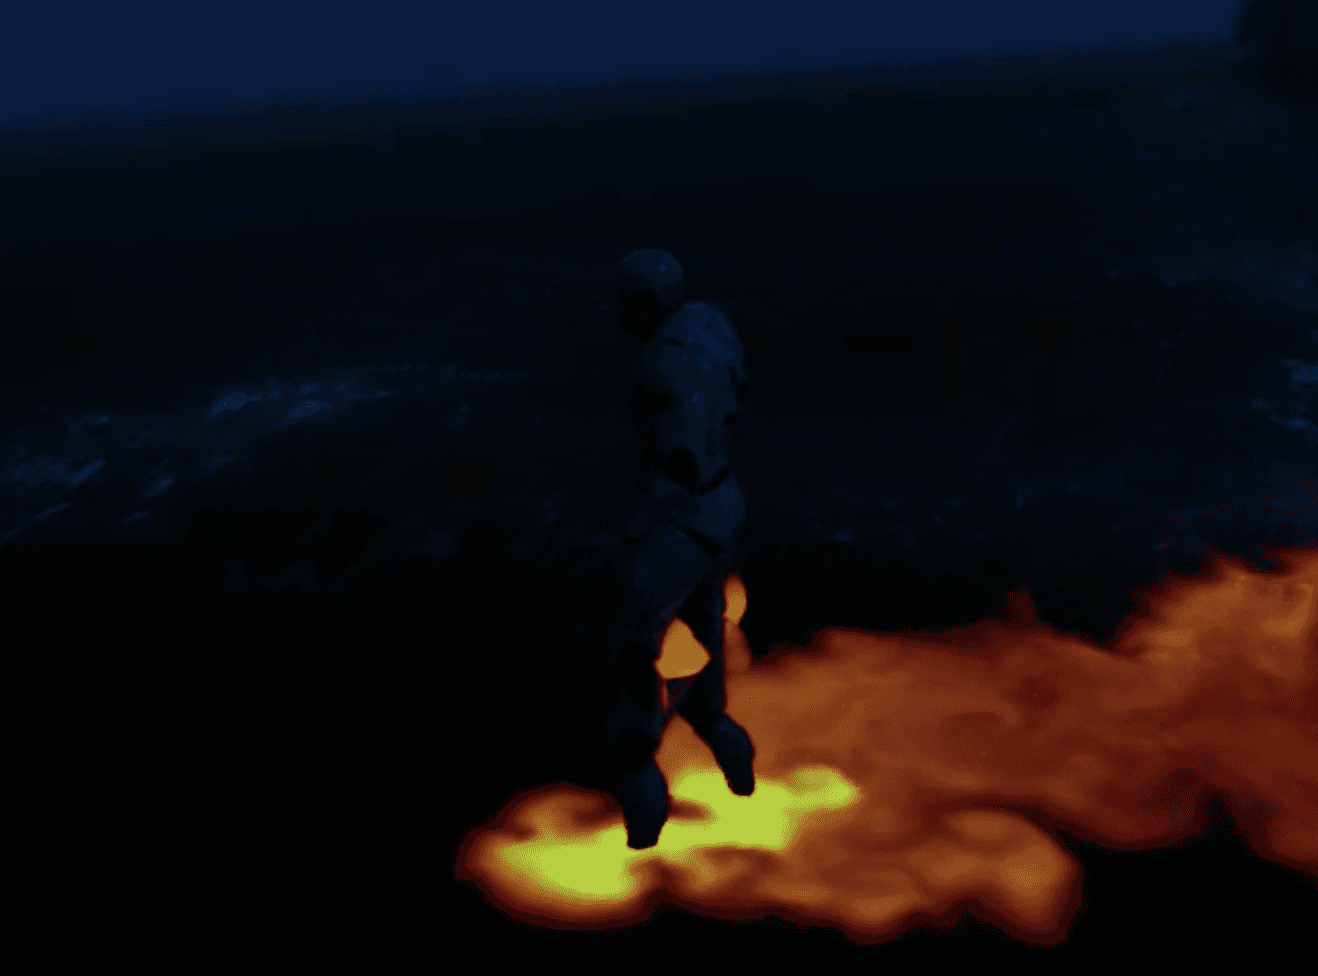
Fire variant. (red, yellow, warm white)
Fire variant. (red, yellow, warm white)

Northern Lights variant. (cyan, violet, white)
Northern Lights variant. (cyan, violet, white)
Figure 12: BioFluidSim Color Parameter Overrides (LowShear, HighShear, Curl)
Figure 12: BioFluidSim Color Parameter Overrides (LowShear, HighShear, Curl)
AmbientColor tints the base surface where no fluid activity is present. White leaves the emission colors unchanged; a saturated value shifts the entire surface and reduces the contrast the trails depend on.
LowShearColor and HighShearColor ramp across shear magnitude, the same quantity that drives biological activation: low shear is the settled wake, high shear the contact point and leading edge. ShearScale sets how fast the ramp traverses between them.
CurlColor tints vorticity, appearing at swirl centers. Keeping it lighter than either shear color makes vortex structure legible without competing with the trail. CurlScale controls how strongly it reads.
NoiseTex is sampled through UVs distorted by the velocity field, so the texture flows with the fluid and appears only where dye density is nonzero.
EmissiveStrength and BioEmissiveStrength scale output into HDR, and are the easiest way to spoil a variant: past roughly 3.0 the bright cores clip and lose hue, so a tuned high-shear color reads as white anyway. Set the ramp first at low emissive strength, then raise it.
HeightMode and HeightScale drive the parallax occlusion displacement, which gives the snow variant depth without added geometry.
AmbientColor tints the base surface where no fluid activity is present. White leaves the emission colors unchanged; a saturated value shifts the entire surface and reduces the contrast the trails depend on.
LowShearColor and HighShearColor ramp across shear magnitude, the same quantity that drives biological activation: low shear is the settled wake, high shear the contact point and leading edge. ShearScale sets how fast the ramp traverses between them.
CurlColor tints vorticity, appearing at swirl centers. Keeping it lighter than either shear color makes vortex structure legible without competing with the trail. CurlScale controls how strongly it reads.
NoiseTex is sampled through UVs distorted by the velocity field, so the texture flows with the fluid and appears only where dye density is nonzero.
EmissiveStrength and BioEmissiveStrength scale output into HDR, and are the easiest way to spoil a variant: past roughly 3.0 the bright cores clip and lose hue, so a tuned high-shear color reads as white anyway. Set the ramp first at low emissive strength, then raise it.
HeightMode and HeightScale drive the parallax occlusion displacement, which gives the snow variant depth without added geometry.
Visualization Buffer Output (RGBA)
Visualization Buffer Output (RGBA)
Four auxiliary render targets are written from the niagara grid pipeline for development visualization, with no effect on simulation state
Four auxiliary render targets are written from the niagara grid pipeline for development visualization, with no effect on simulation state
Figure 13: Density Buffer: raw dye color and luminance, showing where trails were injected and how they dissipate as they advect
Figure 13: Density Buffer: raw dye color and luminance, showing where trails were injected and how they dissipate as they advect
Figure 14: Velocity Buffer: red and green encode horizontal and vertical direction (yellow base color is resting state)
Figure 14: Velocity Buffer: red and green encode horizontal and vertical direction (yellow base color is resting state)
Figure 15: Divergence Buffer: the divergence of the velocity field. Values remaining near zero confirm that the fluid remains effectively incompressible.
Figure 15: Divergence Buffer: the divergence of the velocity field. Values remaining near zero confirm that the fluid remains effectively incompressible.
Figure 16: Pressure Buffer: greyscale pressure field. Concentric rings propagating outward confirm the Jacobi solver is resolving pressure waves correctly
Figure 16: Pressure Buffer: greyscale pressure field. Concentric rings propagating outward confirm the Jacobi solver is resolving pressure waves correctly
Thank You for Playing!




Thank You for Playing!
Thank You for Playing!